Financial GPS: How to Navigate College Debt Without Drowning
Financial GPS is a new framework for navigating college debt. See how payment burden tiers work, why ROI metrics fall short, and how to find schools where debt actually works.


In my last post on "Is College Worth It? How Median ROI Hides a Harsh Reality" I shared some commentary around "affordability" which I realized I should have explained better. That's why I created the Financial GPS framework to explain my framework around thinking about college affordability.
In my startup (A.M. Money) and the last full-time role I had at Moneythink, we were both supported by the Financial Health Network. One of the coolest things they did was create something called the FinHealth Score® to help financial institutions assess whether someone is in good financial health.
I've always admired the thought they put into that framework, and I've used something inspired by it in all the work I've done since. This is no different.
In general, I find a lot of the frameworks around ROI to be wholly insufficient and not consistent with the lived experiences of many people.
Here's why: Gross numbers sound great, but gross doesn't really tell you what you need to know.
One of the things about finances after college is that a bunch of things hit you all at once. You have to buy that first car. You have to get that first suit. You have to put down a deposit on an apartment and start paying rent. All of these things happen at the same time and everyone just assumes, "well, you went to college, surely you've got this."
But we know that's not actually the case.
When you model student loans, you realize that most loans that default, default early. And it's because of things like this the cash crunch that hits right when repayment starts. What you also see is that these defaults often rehab and stabilize over time, especially for graduates. This is part of what's going on.
So I created the Financial GPS framework, which breaks down how I think about affordability at various schools and within various programs. The key insight: it's not about a gross number like income or debt. It's about what you look like financially when you enter repayment — and how much of a burden that creates.
This matters because not everyone's situation is the same. Someone who can focus on school without worrying about other responsibilities is in a very different position than someone supporting a family or dealing with other forms of debt.
The way I think about this framework: it tells you how much "slack" you could have for a given institution or program. The Financial GPS tool lets you play with this — exploring what it looks like for different scenarios, like whether the student has to cover the parent's portion or vice versa.
This is obviously informed by a lot of work I've done over the past decade, but I don't have a monopoly on knowledge here. I'd love people's feedback.
Either way — more on what's there below.
What is the Financial GPS Framework?
The core question the Financial GPS framework tries to answer is: How much slack do you actually have?
Not "what's your debt-to-income ratio?" — but "after you cover the basics, how much room do you have to breathe?"
Here's how we think about it:
Start with your expected earnings after graduation. For this, we use median earnings by program from the College Scorecard (2024 data) — what the typical graduate actually makes.
Then subtract what it costs to cover the basics. The federal government uses 150% of the Federal Poverty Level ($22,590 for a single person in 2024) as the threshold for "basic living expenses" in their Income-Driven Repayment programs. We use the same standard — not because it's perfect, but because it's an established baseline that helps people wrap their heads around the concept.
What's left is your discretionary income — what you could theoretically put toward loan payments, savings, or anything else.
A quick note on that $22,590 figure: It's a national average. It doesn't account for the fact that cost of living in Chicago is very different from cost of living in rural Kansas. We'll talk more about this in the caveats section — but for now, think of it as a baseline, not a guarantee.
The math:
Discretionary Income = Earnings − $22,590
Then we look at what your loan payment would be under a standard 10-year repayment plan. This is the "expected payment" — what you'd owe if you just paid it off in 10 years without any income-driven plans.
Payment burden is simply: what percentage of your discretionary income goes to that payment?
Payment Burden = (Annual Payment ÷ Discretionary Income) × 100
If we assume the same institution-wide median debt, two students at the same school with the same debt and the same monthly payment can have wildly different payment burdens — because their earnings are different.
Take DePaul as an example:
| CS Graduate | Art Graduate | |
|---|---|---|
| Earnings | $79,863 | $36,529 |
| Institution Median Debt | $23,168 | $23,168 |
| Monthly Payment | $264 | $264 |
| Discretionary Income | $57,273 | $13,939 |
| Payment Burden | 5.5% | 22.8% |
Data: College Scorecard 2024, median earnings 10 years after enrollment
Same school. Same debt. Same payment. But the CS grad has plenty of slack — the Art grad is stretched thin.
This is why program-level analysis matters. The school isn't affordable or unaffordable. The program determines your slack.
Payment Burden Tiers
So what do these payment burden percentages actually mean?
The way I think about the tiers is in terms of payback time — and whether or not you'd need Income-Driven Repayment to make it work.
🟢 Excellent (< 8% of discretionary income)
You have a lot of room for error. All of those things we mentioned — the car, the suit, the deposit — won't necessarily stop you from making a payment. You could realistically pay this off in under 10 years, even paying early if you put 10% of your income toward it.
🟢 Good (8-12%)
Still manageable. You can realistically stick to a standard 10-year plan without much strain. Some flexibility, but less room for surprises.
🟡 Concerning (12-20%)
You're on the edge. A standard 10-year plan is tight. Realistically, you might be looking at 15 years, or considering IBR to give yourself breathing room.
🔴 High Risk (> 20%)
This is where payback realistically stretches toward "never" without forgiveness. IBR is probably necessary. Most of your discretionary income is going to debt service. Very little slack.
The key insight: above the line (Excellent/Good), you're in control. Below it, you're increasingly dependent on IBR programs to make the math work — and that comes with trade-offs we'll cover later.
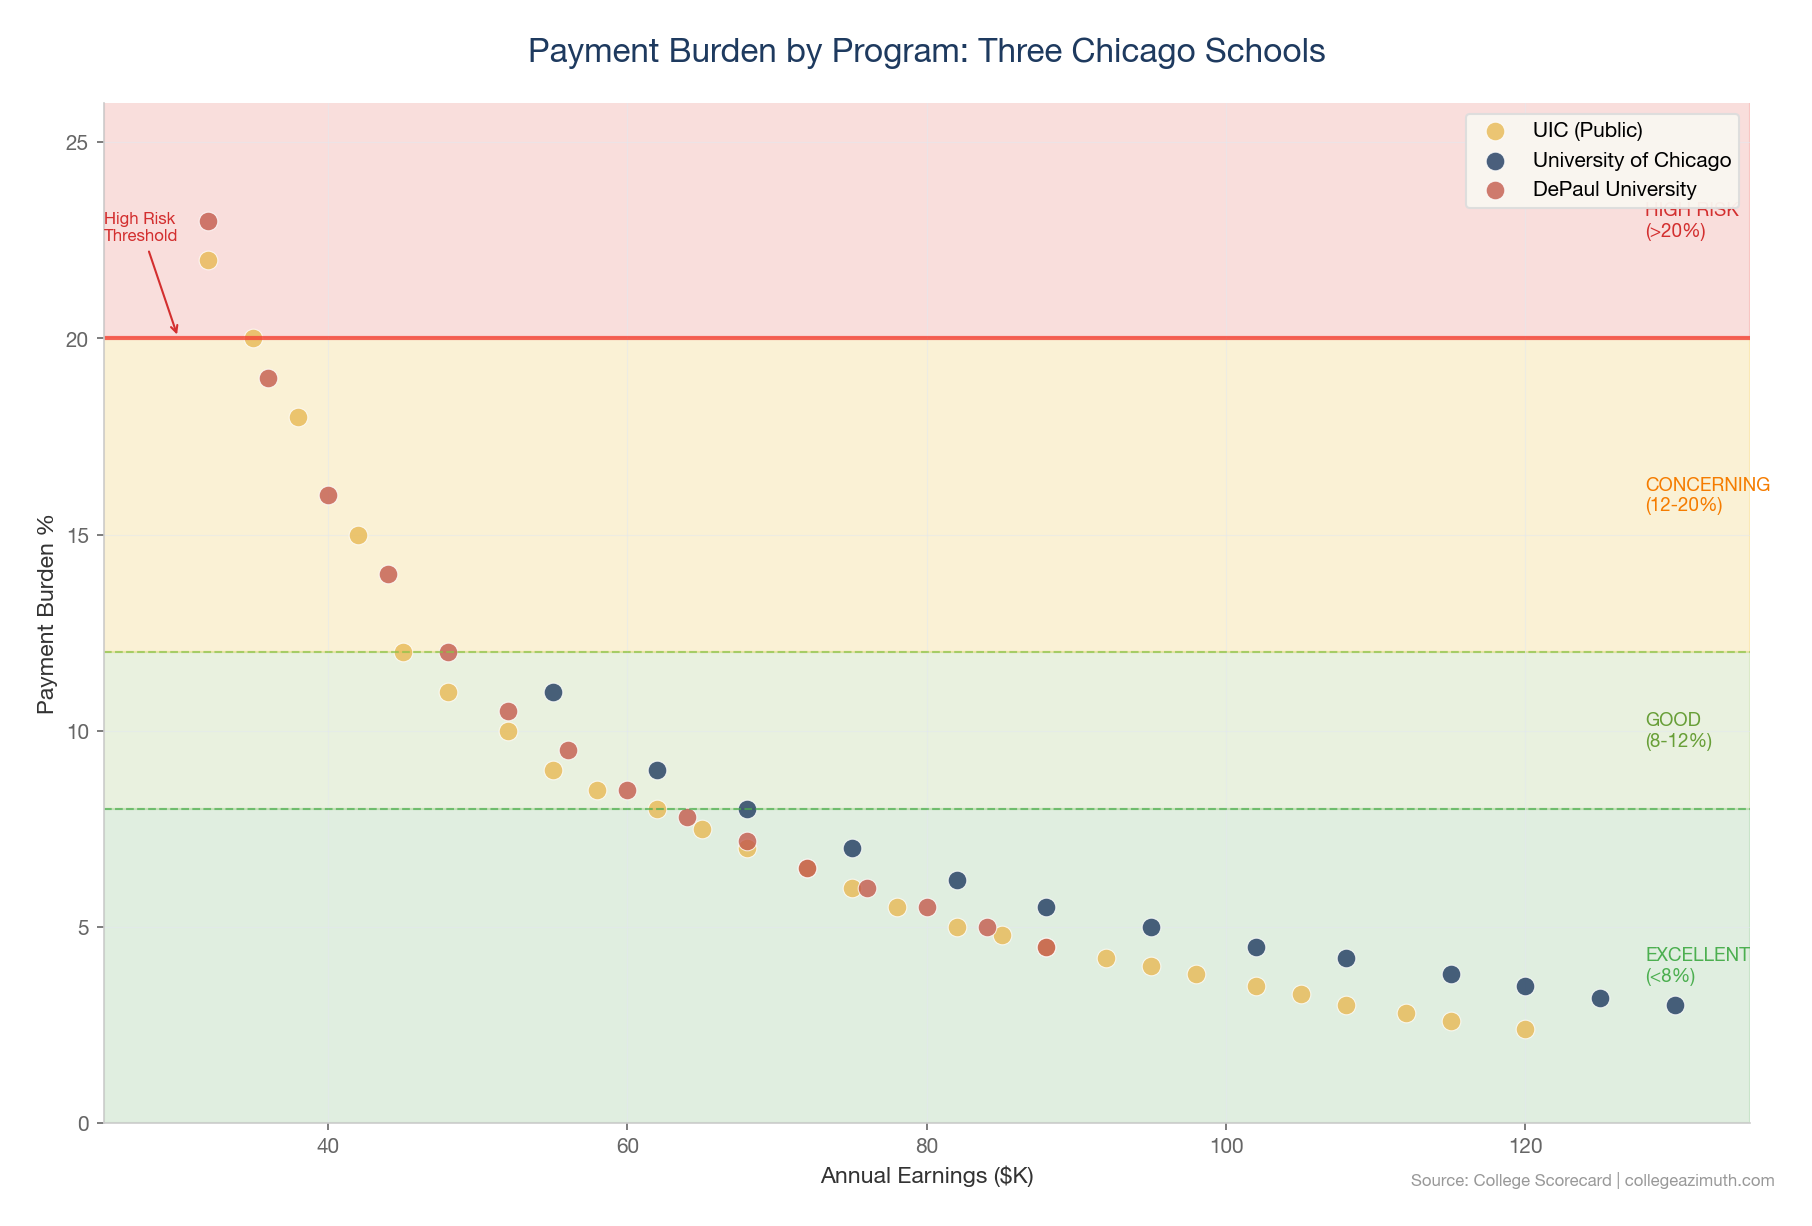
How does this play out across schools?
Let's look at three Chicago-area schools: UIC (public), University of Chicago (private elite), and DePaul (private).
| Institution | Programs | Excellent | Good | Manageable | Challenging+ |
|---|---|---|---|---|---|
| UIC | 51 | 27 (53%) | 11 (22%) | 5 (10%) | 8 (16%) |
| University of Chicago | 21 | 14 (67%) | 1 (5%) | 3 (14%) | 3 (14%) |
| DePaul | 47 | 16 (34%) | 12 (26%) | 12 (26%) | 7 (15%) |
Data: College Scorecard 2024
A few things stand out:
- UIC has the most programs (51) and over half are in the Excellent tier. Strong public option.
- UChicago is heavily concentrated in Excellent (67%), but with fewer programs overall. The programs they offer tend to lead to high-earning fields.
- DePaul is well-distributed across all tiers. This is why program selection matters so much there — some programs give you plenty of slack, others don't.
What the tiers are NOT:
These are not guarantees. They're a framework for thinking about the decision.
Life happens. People take out more debt than the median. Interest accrues during school. Some go to graduate school. People get married, have kids, deal with health issues. All sorts of events change the calculus.
So think of this as a starting point — a way to understand what you're walking into — not a promise of what your situation will be.
IBR — Locking In Affordability (At a Cost)
If your payment burden puts you in the Concerning or High Risk zone, you're probably going to need Income-Driven Repayment to make the math work.
IBR (and related plans like PAYE and SAVE) cap your monthly payment at a percentage of your discretionary income — usually 10%. That's the same discretionary income calculation we talked about earlier: earnings minus $22,590.
In some respects, this can be a good thing.
For the graduate who doesn't have a lot of support, and needs some time to find a good job, catch up, and get stable — IBR is a lifeline. It buys you time and space to do all of this without falling into default or wrecking your credit.
But it's not a long-term solution.
Every dollar of interest that's left unpaid turns into principal. Which turns into more interest. Have you heard those stories about people who have been paying on their loans for decades, and their balances are the same — or even higher? This is what's going on.
It's important to understand what IBR is good for, and what it's not. Otherwise, you could end up in the worst possible situation: not making progress on a loan you've already paid back — and then some.
And there are limitations:
- Federal loans only. Private loans don't qualify for income-driven repayment at all.
- Parent PLUS is different. Parent PLUS loans don't qualify for most IDR plans. The only option is to consolidate into a Direct Consolidation Loan and enroll in ICR (Income-Contingent Repayment) — which calculates payments at 20% of discretionary income, not 10%. That's a much worse deal.
- Ongoing litigation. There's been significant legal uncertainty around some of these programs, particularly SAVE. This has made things unpredictable for borrowers — plans can change, enrollment can be paused. It's a moving target.
- Forgiveness isn't guaranteed. Some IBR plans offer forgiveness after 20-25 years of payments. But I wouldn't build a financial plan that depends on it. More on forgiveness programs in a future post.
Where to learn more: Federal Student Aid has the full breakdown of IDR plans and eligibility requirements.
The bottom line: IBR can lock in affordability when the numbers don't otherwise work — and give you the breathing room you need early on. But it's a trade-off, not a free pass. If you're relying on IBR to make a school affordable, understand what you're signing up for.
Caveats — Your Circumstances May Vary
The GPS framework gives you a starting point. But these are generalized numbers based on medians and national averages. Your situation is specific — and there are factors that can significantly change the math.
Geographic cost of living
The $22,590 baseline (150% FPL) is a national figure. It doesn't know that rent in San Francisco is three times what it is in Indianapolis. If you're graduating into a high-cost city — which many graduates do, because that's where the jobs are — your actual discretionary income is going to be a lot lower than the formula suggests.
A program that looks "Excellent" on paper might feel "Concerning" once you're paying $2,500/month for a studio apartment. The framework can't account for this, so you need to.
Family size and dependents
The calculation assumes a single person. If you're supporting kids, a spouse who's not working, or aging parents — your expenses look completely different. What the formula calls "discretionary income" might already be spoken for.
This is especially relevant for non-traditional students. A 30-year-old going back to school with two kids has a very different reality than a 22-year-old with no dependents.
Other debt
Student loans don't exist in isolation. Credit card debt, car payments, medical bills — they all compete for the same discretionary income. If you're already stretched by other obligations, the "slack" that GPS shows you isn't really available.
And don't forget parent debt. If your family took out Parent PLUS loans to cover the gap, that's real debt too — even if it's not in your name. As I wrote in "The Family Debt Reality," it's not just student debt, it's family debt. If you're planning to help your parents pay it back, or if they're counting on you to, that changes your math entirely.
Before you trust the tier, take an honest look at what else is on the balance sheet — yours and your family's.
Career trajectory
The framework uses median earnings — what the typical graduate makes. But you're not the median. Some people land jobs that pay well above median right out of school. Others take longer to get there. Some fields have steep growth curves; others plateau early.
The tier tells you what's typical. Your path might be better or worse. If you're betting on being above median, make sure you understand the odds.
And that's not all.
There are plenty of other factors that can shift the picture: health conditions that require ongoing expenses, your housing situation (living with family vs. paying rent), whether you have a support system that can help in emergencies or whether you're the one others depend on, how much savings you have when you start repayment, whether you're working while in school, and more.
The point isn't to list every possible variable. It's to drive home that this is super important to get right — and the nuance matters. The GPS framework is a tool to help you think through the decision. It's not a substitute for thinking through your own situation.
Try It Yourself
Everything I've described here is built into the Financial GPS tool.
It's designed to be simple:
- Select your schools — Choose up to 3 colleges you're considering
- Determine family contribution — Toggle whether you're an independent student, and see net prices customized to your income bracket
- Compare outcomes — Review 10-year earnings, debt levels, and investment value metrics to see which school delivers the best financial return
You can also dig deeper: - Major Deep-Dive — See what the numbers look like for a specific field - Student vs Parent Risk Check — Understand the burden from each perspective - Split the Bill — See what happens if the student covers the parent's portion, or vice versa
Play around with the Financial GPS tool. See what the slack looks like for schools you're considering. Adjust the scenarios to match your reality.
The framework is meant to help you think — the tool is meant to help you see. (For more on how we calculate these numbers, check out our methodology page.)
What's Next
This post was about the framework — how I think about affordability, and why the typical ROI metrics fall short.
In upcoming posts, I'll apply this framework to identify schools and programs where debt actually works. Where the numbers add up. Where graduates have real slack.
We'll also go deeper on some of the topics I touched on here: forgiveness programs, Parent PLUS, the litigation uncertainty, and more.
If you have thoughts, feedback, or questions — I'd love to hear them. Like I said at the top: I don't have a monopoly on knowledge here. This framework is informed by a lot of work, but it's not the final word.